OD600
CELL DENSITY
MEASUREMENTS
OD600: Understanding Optical Density at 600 nm
The Science of Microbial Growth Measurement
Explore the principles of optical density measurements, light scattering, microbial growth kinetics, and reliable cell density estimation. From fundamental theory to practical laboratory techniques, this resource provides a scientific foundation for understanding, measuring, and interpreting OD600. OD600 is commonly measured using a spectrophotometer or a dedicated optical cell density meter.
What Is OD600?
Optical density at 600 nm (OD600) is a widely used measurement for estimating the density of microbial cells suspended in liquid culture. It provides a rapid, non-destructive method for monitoring microbial growth without requiring direct cell counting.
OD600 measurements are routinely used in microbiology, molecular biology, biotechnology, and fermentation research to monitor bacterial and yeast cultures, characterize growth kinetics, standardize inoculum densities, and determine appropriate sampling or harvesting times.
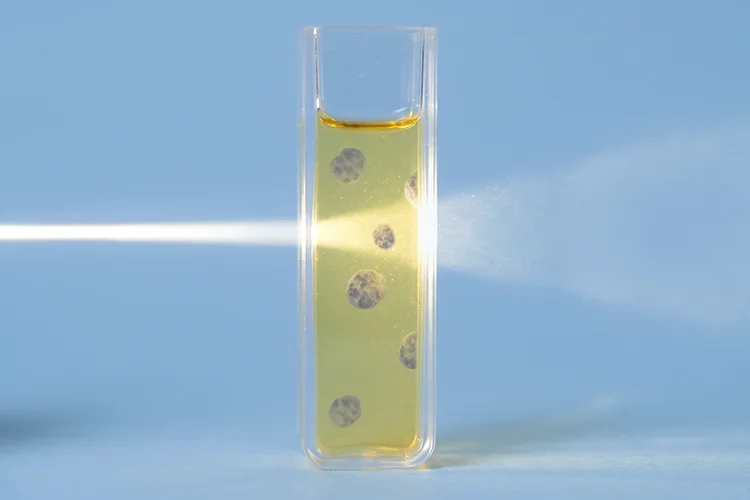
The technique is based primarily on the scattering of light by suspended cells. As the number of cells increases, more light is redirected away from the detector, producing a higher apparent optical density.
However, OD600 is not a direct measurement of cell number or viability. The relationship between optical density and cell concentration depends on multiple factors, including cell morphology, culture conditions, optical pathlength, and instrument design.
Understanding these factors is essential for obtaining reproducible measurements and interpreting microbial growth data correctly.
1
2
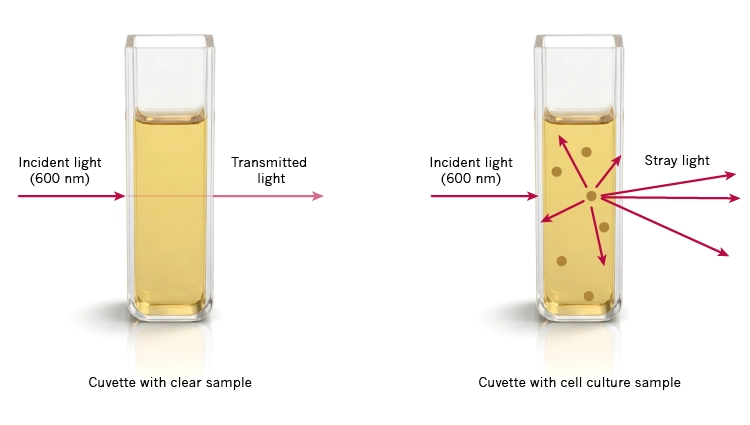
1
Light absorption: Light passing through a clear sample may be absorbed by molecules, reducing the intensity of transmitted light. The Beer-Lambert law describes this relationship under appropriate conditions.
2
Light scattering: Suspended cells and particles redirect incoming light in different directions. The amount of scattered light reaching the detector depends on the optical configuration of the instrument.
Light absorption of clear sample and light scattering of turbid sample
The Science Behind OD600
Light Scattering, Transmittance, and Optical Density
How Does an OD600 Measurement Work?
During an OD600 measurement, light with a nominal wavelength of 600 nm passes through a liquid sample containing suspended microorganisms.
As the light interacts with microbial cells, some of it is scattered in different directions. Depending on the sample and measurement conditions, some light may also be absorbed.
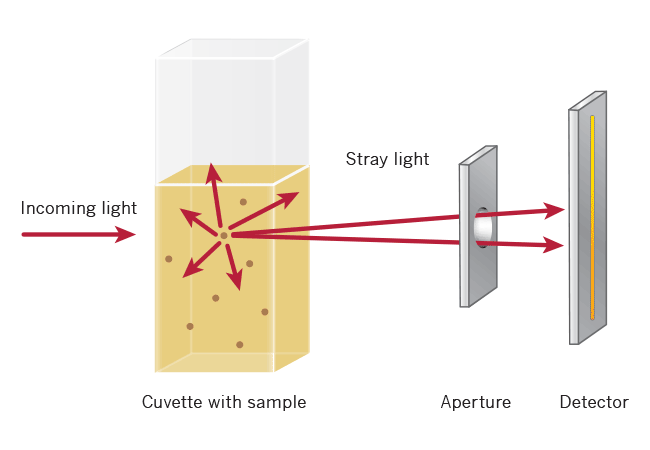
A detector positioned along the optical axis measures the light transmitted through the sample. As the concentration of suspended cells increases, the amount of light reaching the detector generally decreases.
The instrument expresses this reduction as optical density.
The Optical Density Equation
OD600 =
log10(I0 / I)
= −log10(T)
Where:
- I0 = Light intensity measured through the reference or blank
- I = Light intensity measured through the sample
- T = I / I0 = Relative transmittance
For example, if the detector receives 10% of the reference light intensity, the measured optical density is 1.0. If it receives 1%, the optical density is 2.0.
Why Light Scattering Matters
In molecular absorbance measurements, the Beer-Lambert law describes the relationship between absorbance, concentration, optical pathlength, and molar absorptivity under appropriate conditions.
Microbial suspensions behave differently.
Cells are relatively large, complex particles that scatter light rather than simply absorb it. Their scattering behavior depends on cell size, shape, refractive index, aggregation, and the optical geometry of the measurement system.
Consequently, OD600 is often described as an apparent absorbance or turbidity measurement.
Although OD600 may be approximately proportional to cell concentration over a limited range, the classical Beer-Lambert relationship cannot be assumed to apply directly across all microbial concentrations.
Scientific takeaway: OD600 measures the attenuation of transmitted light by a microbial suspension. It provides an indirect estimate of culture density, not an absolute cell count.
How to Measure OD600 Accurately
A Practical Guide to Reliable OD600 Measurements
OD600 measurements are relatively simple to perform, but their reproducibility depends on consistent experimental conditions, sample handling, and instrument configuration.
Step 1. Prepare the Reference Blank
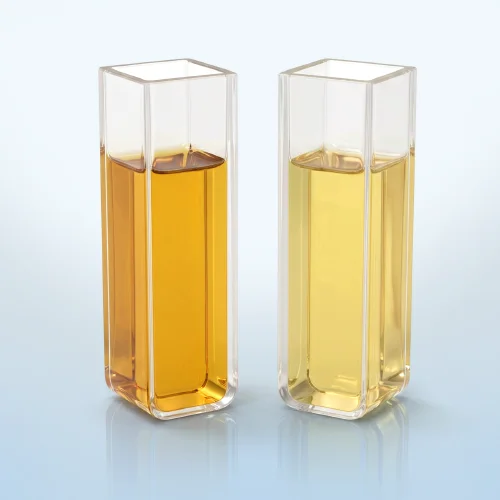
Use the same sterile, cell-free growth medium used for the microbial culture.
The blank compensates for optical contributions from the medium and measurement vessel. Differences in medium composition, color, or turbidity can influence the resulting OD600 measurement.
When measuring cultures in different media, prepare an appropriate blank for each medium.
Step 2. Homogenize the Culture
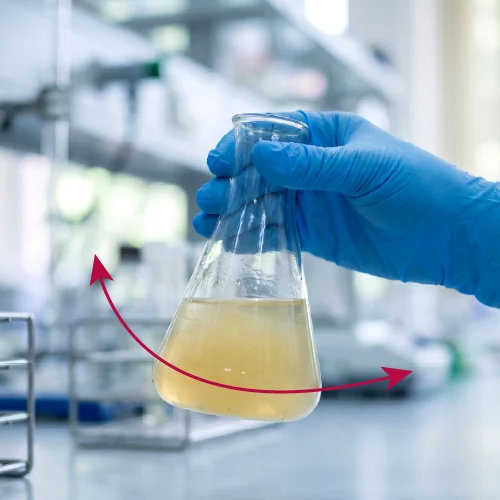
Mix the microbial suspension thoroughly before sampling.
Cells may sediment, aggregate, or distribute unevenly during incubation. Inconsistent mixing can produce significant variation between measurements.
Avoid introducing excessive bubbles or foam, which can interfere with the optical measurement.
Step 3. Select a Measurement Vessel
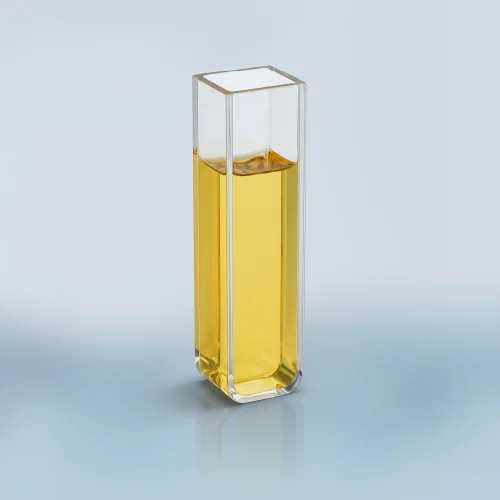
For microbial suspensions, cuvette-based measurements are often preferred over very small-volume droplets because the larger sample volume can provide more representative sampling and improve measurement reproducibility.
Use a clean cuvette or another vessel compatible with the measurement instrument. Maintain consistent optical pathlength, sample volume, and vessel positioning throughout an experiment. Inspect the vessel for fingerprints, scratches, condensation, and air bubbles in the optical path.
Step 4. Measure Within the Validated Range
Confirm that the sample falls within the instrument’s validated measurement range for microbial suspensions.
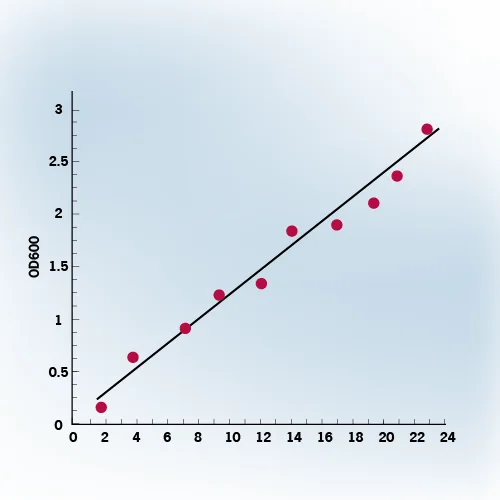
At high culture densities, multiple scattering and instrument-dependent optical effects may cause the relationship between OD600 and cell concentration to become nonlinear.
If necessary, dilute the sample using an appropriate cell-free medium and remeasure it.
Step 5. Record and Interpret the Result
Record the OD600 value together with relevant experimental information, including:
- Organism and strain
- Growth medium and culture conditions
- Sampling time
- Instrument and measurement vessel
- Optical pathlength
- Dilution factor, if applicable
For growth studies, collect measurements at consistent intervals to construct a growth curve.
Correcting for Sample Dilution
When a sample is diluted before measurement, the measured optical density may be multiplied by the dilution factor to estimate the equivalent undiluted OD600, provided the diluted sample is within a validated proportional range.
OD600, equivalent = OD600, measured × DF
For example:
0.45 × 10 = 4.50
Measured OD600: 0.45
Dilution factor: 10×
Equivalent OD600: 4.50
This calculation is valid only when the diluted measurement is within the established proportional range. It should not be interpreted as proof that the undiluted culture could be measured accurately at OD600 = 4.50.
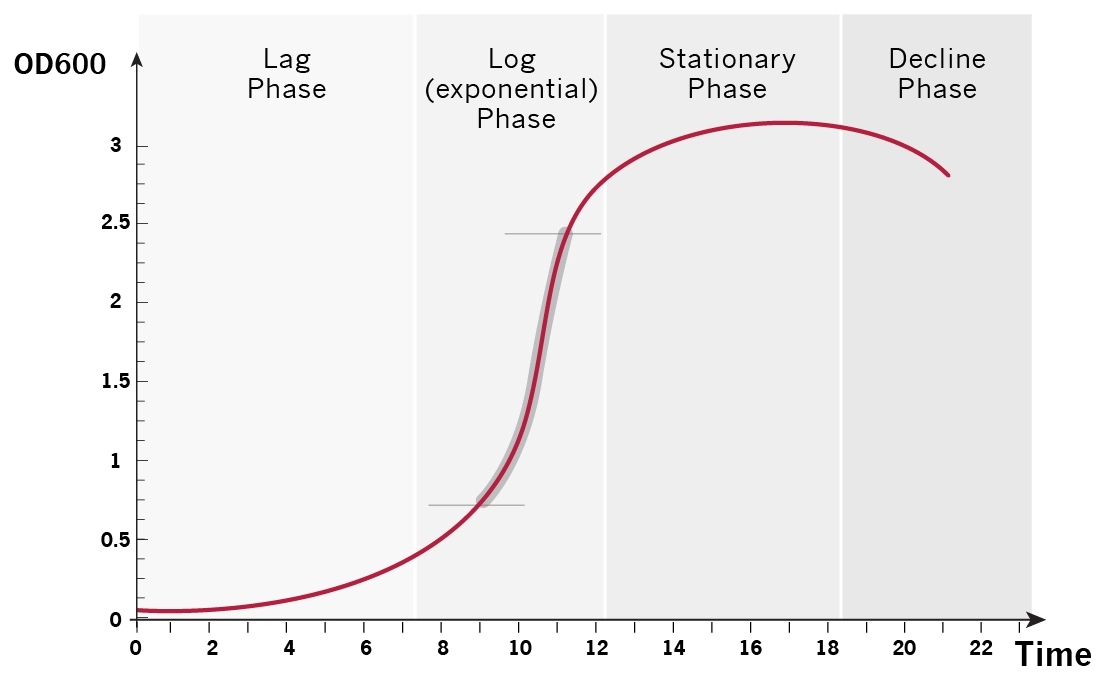
Lag Phase
During the lag phase, microorganisms adapt to their new environment.
Cells may synthesize enzymes, adjust metabolic pathways, repair cellular components, and prepare for division.
The optical density may remain relatively constant even though the cells are metabolically active.
Log Phase
During exponential growth, cells divide at an approximately constant specific growth rate under favorable conditions.
Cell concentration increases exponentially, producing a corresponding increase in OD600 when measurements remain within a validated proportional range.
This phase is particularly important for experiments requiring actively growing cultures, including gene expression studies, protein production, and physiological characterization.
Stationary Phase
As nutrients become depleted and inhibitory metabolic products accumulate, net population growth slows.
The culture may reach a relatively stable optical density as cell division and cell loss approach a balance.
However, a stable OD600 does not necessarily indicate that all cells remain viable or that metabolic activity has stopped.
Decline Phase
During the decline phase, viable cell numbers may decrease because of nutrient exhaustion, toxic byproducts, or other unfavorable environmental conditions.
Importantly, OD600 does not necessarily decrease in parallel with viability.
Nonviable but intact cells may continue scattering light, while cell lysis and changes in cell morphology can alter the optical density independently of viable cell concentration.
Calculating Specific Growth Rate and Doubling Time
During exponential growth, the specific growth rate (μ) can be estimated from two OD600 measurements taken within a validated proportional range:
μ = ln(OD2) − ln(OD1) t2 − t1
Where:
- μ = Specific growth rate (time−1)
- OD1 and OD2 = Optical density measurements
- t1 and t2 = Corresponding measurement times
The doubling time can then be calculated as:
td = ln(2) μ
These calculations assume exponential growth and an approximately proportional relationship between OD600 and cell concentration over the analyzed interval.
BEYOND THE GROWTH CURVE
From Optical Density to Cell Density
OD600, Cell Concentration, and Viability
What Does an OD600 Value Actually Tell You?
OD600 is commonly used as an indirect indicator of microbial cell density, but it does not provide an absolute cell count.
Two cultures with identical OD600 values may contain different numbers of cells because optical scattering depends on physical characteristics of the microorganisms.
For example, larger cells may scatter more light than smaller cells, and changes in morphology or aggregation may affect optical density without a proportional change in cell number.
OD600 vs. CFU/mL
Colony-forming units per milliliter (CFU/mL) estimate the concentration of viable, culturable units capable of forming colonies under the selected growth conditions.
OD600, by contrast, measures optical attenuation caused by the entire suspension, including viable cells, nonviable cells, and other scattering particles.
Furthermore, a single colony may originate from a cell cluster rather than an individual cell.
Consequently, OD600 and CFU/mL provide different types of information and should not be used interchangeably.
OD600 vs. Cells/mL
A relationship between OD600 and cell concentration can be established experimentally by measuring optical density alongside an independent cell-counting method.
Depending on the application, reference measurements may include microscopic cell counts, flow cytometry, or other validated counting techniques.
The resulting calibration curve can be used to estimate cell concentration from OD600 under comparable experimental conditions.
However, a universal OD600-to-cells/mL conversion factor does not exist.
OD600 vs. Biomass
OD600 may also be correlated with microbial biomass, such as dry cell weight, through an experimentally established calibration curve.
Such relationships are particularly useful in fermentation and bioprocess monitoring, where biomass concentration is often more relevant than individual cell counts.
Scientific takeaway: OD600 is an indirect measure of culture turbidity. Converting it into cell number, viable count, or biomass requires an appropriate experimental calibration.
Measurement Range and High-Density Cultures
Understanding OD600 Linearity and Measurement Limitations
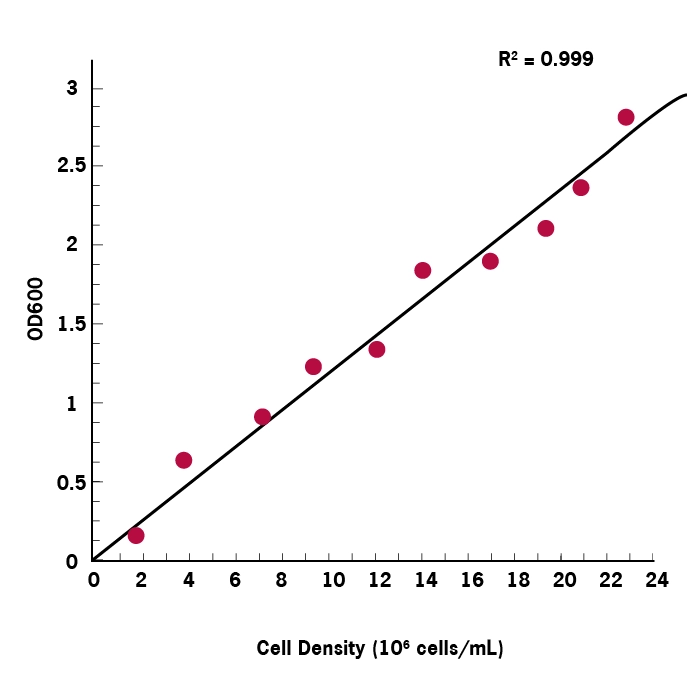
At relatively low cell densities, OD600 may increase approximately proportionally with the concentration of suspended microorganisms.
However, this relationship is valid only over a limited range determined by the organism, sample properties, optical pathlength, and instrument design.
Why Do High OD600 Measurements Become Nonlinear?
As cell density increases, photons may interact with multiple cells before reaching the detector.
This phenomenon, known as multiple scattering, can change the relationship between measured optical density and actual cell concentration.
At higher densities, an increasing proportion of scattered light may also be collected by the detector, depending on the instrument’s optical geometry.
These effects can cause OD600 readings to deviate from a simple proportional relationship with cell concentration.
Strategies for Measuring Dense Cultures
Sample dilution: Diluting a culture with appropriate cell-free medium can bring its optical density into a validated proportional measurement range.
Shorter optical pathlength: A shorter pathlength can reduce the apparent optical density of a concentrated suspension, although the relationship must be validated for the particular instrument and sample.
Instrument-specific calibration: Calibration curves can establish the useful relationship between measured OD600 and cell concentration over the required experimental range.
Extending the OD600 Measurement Range
The linear measurement range of the instrument is an important consideration when monitoring microbial growth throughout the culture cycle. An upper measurement limit of at least 2.5 OD is often desirable to accommodate increasing culture densities and reduce the need for repeated dilutions. However, a broad instrument measurement range does not necessarily guarantee a linear relationship between OD600 and cell concentration. At higher densities, multiple light scattering, changes in cell morphology, and the presence of nonviable cells may affect the results. When samples exceed the validated measurement range, appropriate dilution or pathlength adjustment may be necessary to maintain reliable measurements.
To reduce sample volume requirements and minimize time-consuming manual dilutions, specialized cuvettes such as DiluCell™ provide an alternative approach. DiluCell™ uses a shortened optical pathlength of 1.0 mm instead of the standard 10 mm, allowing measurements with smaller sample volumes and providing automatic sample dilution by a factor of 10 through optical pathlength reduction. This virtual dilution can simplify high-density culture measurements, reduce pipetting steps, and minimize errors and contamination risks associated with manual dilution procedures.
Why There Is No Universal OD600 Linear Range
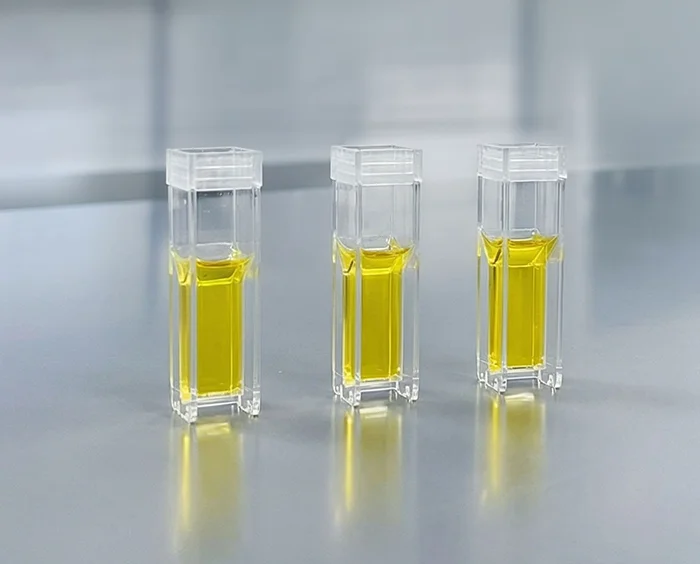
The useful measurement range varies among instruments and microbial samples.
An OD600 value that can be measured reproducibly by one instrument may not be directly comparable to the same nominal value obtained using another optical configuration.
Researchers should distinguish between an instrument’s specified optical density measurement range and the experimentally validated range over which OD600 remains proportional to cell concentration.
Scientific takeaway: OD600 is an indirect measure of culture turbidity. Converting it into cell number, viable count, or biomass requires an appropriate experimental calibration.
Not All OD600 Measurements Are Equal
THE ROLE OF OPTICAL DESIGN
Why OD600 Results Differ Between Instruments
The Influence of Optical Geometry on OD600 Measurements
One of the most important limitations of OD600 measurements is that results are not always directly comparable between different spectrophotometers.
Unlike the absorbance of an ideal molecular solution, the apparent optical density of a microbial suspension depends strongly on how the instrument collects transmitted and scattered light.

Higher absorbance reading

Lower absorbance reading
Detector Acceptance Angle
Some light scattered by microbial cells travels at small angles relative to the original beam. Depending on detector size, distance, and optical geometry, a portion of this forward-scattered light may reach the detector. Instruments that collect different proportions of scattered light may report different OD600 values for the same sample.
Optical Pathlength
Optical pathlength influences the interaction between light and suspended particles.
Measurements made using different pathlengths may require normalization or calibration before meaningful comparisons can be made.
Wavelength and Spectral Bandwidth
Although OD600 measurements are nominally performed at 600 nm, differences in wavelength accuracy, spectral bandwidth, and light-source characteristics can contribute to variation between instruments.
Sample Vessel Geometry
Cuvette dimensions, tube diameter, optical quality, and vessel positioning may influence the measurement.
Measurements made using different vessel formats should not automatically be assumed to be equivalent.
How to Compare OD600 Measurements Across Instruments
For experiments requiring cross-instrument comparability, researchers should establish an empirical relationship using representative microbial suspensions measured under consistent conditions.
Where appropriate, instrument-specific calibration curves can be developed against an independent cell concentration or biomass reference.
Scientific takeaway: OD600 is an instrument-dependent optical measurement. Standardizing the measurement procedure and calibrating across instruments improves reproducibility and comparability.
Using Correction Factors for Instrument Comparability
Some spectrophotometers and optical cell density meters allow users to apply a correction factor to OD600 measurements. A default correction factor of 1 leaves the measured value unchanged. When comparing results between instruments with different optical configurations, an experimentally determined correction factor can help normalize measurements to a reference instrument.
The correction factor should be established using the same representative microbial samples measured under consistent conditions. A single correction factor is appropriate only when the relationship between instruments is approximately proportional across the relevant measurement range. For more complex differences, instrument-specific calibration curves may provide greater accuracy.
What Is a Cell Density Meter?
A cell density meter is a laboratory instrument used to estimate the concentration of cells suspended in a liquid sample. In microbiology, optical cell density meters commonly measure turbidity or light scattering to assess the relative density of bacterial, yeast, and other microbial cultures.
One of the most widely used approaches is optical density measurement at 600 nm (OD600), which provides a rapid, non-destructive method for monitoring microbial growth and estimating culture density.
How Does an Optical Cell Density Meter Work?
An optical cell density meter directs light through a microbial suspension and measures the reduction in transmitted light caused primarily by scattering from suspended cells.
As cell density increases, the apparent optical density generally rises, allowing researchers to monitor changes in culture density without directly counting individual cells.
However, optical cell density measurements are indirect. They cannot independently distinguish viable from nonviable cells, and the relationship between optical density and cell concentration depends on the organism, sample properties, and instrument configuration.
When Is a Dedicated Cell Density Meter Useful?
A dedicated cell density meter may be particularly useful in laboratories that perform frequent microbial culture measurements, including routine growth monitoring, fermentation research, inoculum preparation, and microbiological quality control.
Instrument selection should consider the required measurement range, sample vessel compatibility, optical pathlength, measurement reproducibility, and available calibration procedures.
Scientific takeaway: An optical cell density meter provides a convenient way to monitor microbial culture turbidity, but quantitative cell concentration estimates require appropriate calibration.
Cell Density Meter vs. Spectrophotometer
Both instruments can be used to measure microbial culture turbidity, but they differ in their intended applications.
| Feature | Optical Cell Density Meter | UV-Vis Spectrophotometer |
|---|---|---|
| Primary Purpose | Estimating cell suspension density | Measuring light attenuation across selected wavelengths |
| OD600 Measurements | Commonly supported | Supported when 600 nm is available |
| Wavelength Selection | Often fixed or application-specific | Typically adjustable |
| Microbial Growth Monitoring | Common application | Common application |
| Other Analytical Applications | Depends on instrument | DNA, RNA, protein, and other absorbance-based measurements, depending on configuration |
OD600 vs. McFarland Standards
Two Approaches to Microbial Turbidity Measurement
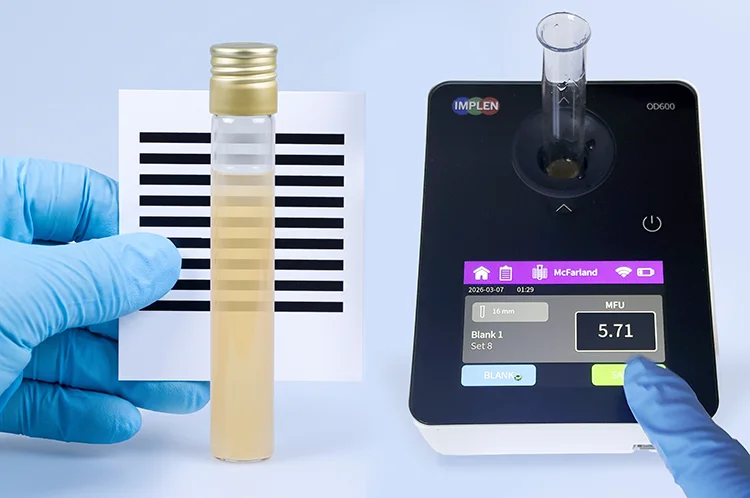
OD600 measurements and McFarland turbidity standards are both used in microbiology, but they serve different purposes.
OD600 Measurements
OD600 is commonly used to monitor microbial growth and estimate relative culture density.
It is particularly valuable for kinetic measurements, growth curves, fermentation monitoring, and experimental workflows requiring repeated measurements over time.
McFarland Standards
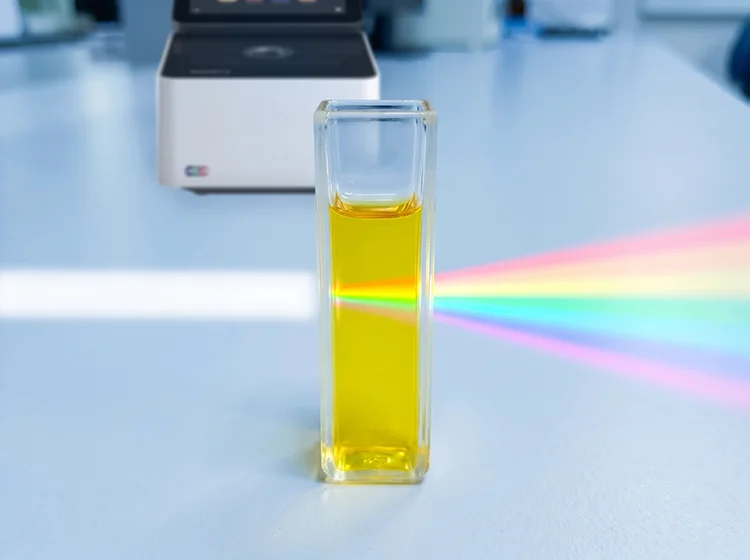
McFarland standards are turbidity references used to standardize microbial suspensions.
They are widely used in clinical microbiology, particularly when preparing bacterial inocula for antimicrobial susceptibility testing.
A 0.5 McFarland standard is often associated with a bacterial suspension of approximately 1.5 x 10⁸ CFU/mL for certain organisms and methods, but the actual viable count varies with the organism and preparation.
Are OD600 and McFarland Values Interchangeable?
No. Although both approaches assess turbidity, they use different measurement conventions and calibration principles.
There is no universal conversion between an OD600 reading and a McFarland value.
For standardized microbiological procedures, researchers should follow the relevant validated protocol and instrument-specific calibration requirements.
Applications of OD600
Applications in Microbiology, Biotechnology, and Life Sciences
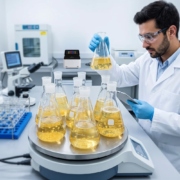
Microbial Growth Monitoring
Track changes in culture turbidity over time to study bacterial and yeast growth under different environmental and nutritional conditions.
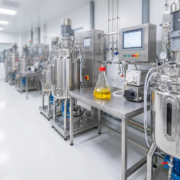
Fermentation and Bioprocess Development
Monitor microbial biomass trends during cultivation, process optimization, and fermentation experiments.
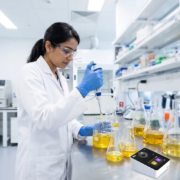
Recombinant Protein Expression
Identify appropriate culture growth stages for induction and harvesting in microbial expression systems.
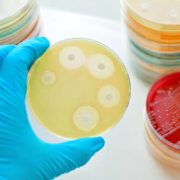
Antimicrobial Research
Follow microbial growth responses to experimental treatments, with complementary assays used when viability or susceptibility must be established.
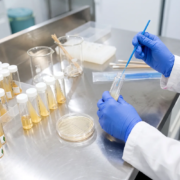
Inoculum Preparation and Standardization
Prepare microbial suspensions with controlled turbidity for experimental procedures and validated microbiological workflows.
Troubleshooting OD600 Measurements
Common Sources of OD600 Measurement Error
Reliable OD600 measurements depend on understanding the experimental and optical factors that can affect the result.
| Observation | Possible Cause | Recommended Action |
|---|---|---|
| Readings change between repeated measurements | Cell sedimentation or inconsistent mixing | Mix immediately before each reading |
| Unexpectedly high OD600 | Bubbles, aggregates, debris, or sample turbidity | Inspect and prepare the sample consistently |
| Unexpectedly low OD600 | Incorrect blank, dilution, or sample handling | Verify blank and dilution procedure |
| Poor agreement between replicates | Uneven cell distribution or inconsistent vessels | Standardize mixing, vessels, and sampling |
| OD600 no longer increases proportionally | Multiple scattering or measurement-range limitations | Dilute the sample and validate proportionality |
| Different instruments report different values | Differences in optical geometry and scattered-light collection | Use cross-instrument calibration |
| OD600 remains high after cells lose viability | Nonviable intact cells continue scattering light | Use an independent viability assay |
| Growth curves show unexpected fluctuations | Aggregation, settling, bubbles, or changes in cell morphology | Check sample handling and culture behavior |
Best Practices for Reproducibility
Use consistent growth media, sample vessels, optical pathlengths, measurement intervals, and mixing procedures.
When quantitative comparisons are required, document instrument settings and validate the relationship between OD600 and the biological parameter of interest.
Frequently Asked Questions About OD600
Why is 600 nm used for measuring microbial growth?
The wavelength of 600 nm is widely used because many common microbial growth media and cellular components exhibit relatively low molecular absorbance at this wavelength, allowing culture turbidity to be monitored primarily through light scattering. It is also an established convention that facilitates standardized laboratory workflows. However, suitability depends on the sample and medium.
Does OD600 measure living cells?
No. OD600 measures the optical attenuation produced by suspended particles, including both viable and nonviable cells. It cannot independently distinguish living cells from dead cells.
Can OD600 be converted directly into CFU/mL?
Not using a universal conversion factor. A relationship between OD600 and CFU/mL must be established experimentally for the organism, growth conditions, and measurement system.
What is a good OD600 value for bacterial growth?
There is no universally optimal OD600 value. The appropriate value depends on the organism, experimental purpose, growth conditions, and measurement system. Some laboratory protocols specify particular OD600 ranges for induction, harvesting, or inoculation.
Why can two instruments produce different OD600 readings?
Different optical configurations collect different proportions of forward-scattered light. Detector geometry, optical pathlength, vessel design, and other instrument characteristics can affect the reported value.
Can OD600 be used to calculate doubling time?
Yes, provided the culture is in exponential growth and the OD600 measurements remain approximately proportional to cell concentration. Doubling time can be calculated from the specific growth rate derived from the logarithmic change in OD600 over time.
Why does OD600 become nonlinear at high cell concentrations?
At high densities, multiple scattering and instrument-dependent light collection can cause the measured optical density to deviate from a proportional relationship with cell concentration.
Is OD600 the same as absorbance?
OD600 is often displayed in absorbance units, but for microbial suspensions it primarily reflects light scattering rather than molecular absorption. It is therefore best interpreted as an apparent optical density measurement.
OD600 Tool
Click on the link below to access a spreadsheet OD600 Tool, version 1.2, that helps generate microbial growth curves according to OD600 values as well as to calculate other values of interest for microbiology experiments like cell forming units CFU/mL or time of inoculation. Once instrument calibration and standard curve have been established, it can easily be used to document growth experiments for any type of cell culture.
Explore OD600 Measurement Resources
Spectrophotometers and accessories for OD600 readings
For additional information about OD600 instrumentation, microbial cell density measurement, and laboratory applications, explore the following resources.

The temperature-controlled cuvette port of the NanoPhotometer® C40 provides an unmatched dynamic range of up to 2.6 Abs without the need for a cover during the reading. OD600 readings for Cell Density, Bacterial Growth and Yeast Growth are possible much faster and within a comfortable dynamic range. Features rapid scan capability for 200 – 900 nm.

DiluCell™ provides automatic 1/10 dilutions of higher concentrated samples and bubble-free filling for standard 1 cm cuvette compatible spectrophotometers and is the ideal tool for OD600 readings for Cell Density, Bacterial Growth and Yeast Growth. DiluCell™ allows for convenient spectrophotometric analysis from 340 – 1100 nm.

The Implen OD600® is a user-friendly device for measuring sample optical density at ~600 nm, ideal for various applications including cell growth rates and McFarland turbidity measurements. It’s extremely lightweight, compact and portable, with utmost compatibility (DiluCell, Cuvette, Tubes) without adapters, it offers seamless integration into LIMS.